Trivializing Static Binary Instrumentation with Stitch
Written by pygrum
# Table Of Contents
# Introduction
I came across a blog post from Google a little while back discussing the techniques China-nexus threat actors employed to make reverse engineering their implants significantly harder. The post talked about ScatterBrain, a custom compiler that was being used to obfuscate ShadowPad, a known malware family. PwC came across what now seems to be an earlier, less sophisticated version of ScatterBrain.
I’d recommend having a read of each post. Essentially, the main obfuscation technique involved replacing calls to ' protected’ functions with a series of indirect jumps to encoded locations that were embedded in the code. PwC had a suspicion that this was being done using LLVM’s compiler pass framework, which was incorrect. Information such as the distance to another function (outside the current translation unit) cannot be known before program linkage. This was confirmed when an actual implementation of ScatterBrain was released, which as I suspected involved a combination of LLVM and binary-level work.
After doing some research, I found that there isn’t much public tooling available for static instrumentation. Of course there are some defense-funded (shocker!) private projects and a few bin2bin obfuscators, but nothing that provided the generic capability of recovering and rewriting of code on a function level.

# Creating Stitch
Stitch is a framework that allows for rewriting of code in compiled binaries at a function level. It performs control flow recovery, tail call analysis, liveness analysis and more to provide a user with as much useful information as possible to modify a program’s behaviour.
Yes, Stitch was originally made for obfuscation, but being able to edit code in compiled files is on its own quite a useful capability. Logging, de-obfuscation, execution tracing and many other potential use cases come to mind that would provide some benefits to binary analysis / vulnerability research spaces.
One of the main design goals of the project was to have the binary reformatting and code analysis components logically separate. How code is processed should be almost completely independent of the type of binary we’re working with - PE, ELF, or any other format. I say “almost” because there are still some binary properties that should be considered, such as the platform it runs on (to follow the correct ABI during analysis).
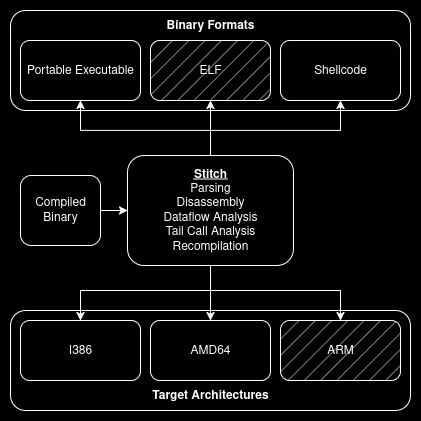
Grayed-out components haven't been implemented
Each format inherits from the Binary class, and each architecture from the Code class. This abstraction makes it
possible to have as many binary formats + target architectures automatically compatible with each other once they’ve
been implemented, as these objects are only referenced through their top-level class internally.
Writing the parsers and recompilers for each binary format was mostly tedious, though getting code to work properly the first time has been a longstanding challenge for me. I won’t go into detail about my implementation, just that it was a lot of docs and a lot of tears. What’s more interesting to us is the code analysis, which provides a relatively mature understanding of each function’s control flow and instruction properties.
## Code Instances
The Code class stores all the functions that have been / will be parsed from the binary. All reachable functions are
analyzed on initialization of Code - but if a user requests parsing from an address that hasn’t been seen, a new
function object is created, starting from that bit of code until its natural termination (e.g. ret). All analysis
passes are run on the new function, providing the same amount of context as any other.
|
|
The Code class is almost entirely virtual so it’s up to each child class to implement the core logic. Users should be
able to edit code within an existing function or rebuild it entirely. Providing this level of flexibility means that
support for certain features (e.g. exceptions) is not built-in, as I don’t know how a user intends to modify each
function. Plus I ain’t getting paid for allat.
## Death, Taxes and Tail Calls
There are only 3 certainties in this life.
I tried to escape doing complete recursive traversal out of fear that Stitch would run into a function that it disagreed
with. But it had to be done if I wanted to reliably handle tail calls, which can prove to be
a huge issue whenever they’re present. And with the small price of + ~
500s of additional runtime, the choice was clear.
The added time was measured on a small test binary. If you’re looking to obfuscate a Sliver payload though you could probably get away with a power nap in-between runs.
### Control Flow Recovery
Disassembly starts from the entrypoint. Each time a jmp / jcc (conditional jump) is reached, we call buildBasicBlocks
again from within itself. Each time a call instruction with an immediate operand is reached, the analyzeFunction
method is called again with the address specified by the operand.
|
|
Notice how we’re sometimes adding the current basic block to the exit_blocks_ set? We’ll need to know the exit points
of each function for any analysis that needs to be done backwards. The termination reason for the current block is also
set, which we will use for other forms of analysis later.
### Splitting / Linking Blocks
In x86 assembly, a conditional jump redirects control flow to another part of the code if it’s taken. Otherwise, the CPU continues to execute the instructions sequentially. This leads to a small issue - what happens when we reach some code that we’ve analysed already? Or worse, what if a jump destination is right in the middle of an existing block? In theory, the solution is simple - split the basic block that the jump is bound for.
There are several things to remember when splitting a block.
- All instructions that fall under the first part of the original block need to be associated with the newly created block.
- The sizes of the two blocks that resulted from the split need to be set appropriately.
- The second block must be marked as an exit block if the original was.
- The second block must inherit the original block’s termination reason.
|
|
I forgot to implement all of these the first time, resulting in lots of bugs and confusion. In fact, I didn’t implement the last point until I wrote it for this post. Theory will only take you so far.
### (Reliably) Detecting Tail Calls
So what’s the most reliable way to detect tail calls? Here are a couple ideas I initially came up with:
- Every time an unconditional
jmpis made, record the region that was jumped over. If it isn’t visited at all again, then it’s a tail call. - Recursively disassemble everything reachable from the entrypoint. During the analysis phase, check each
jmpto see if the destination is a known function. If it is, then it’s likely a tail call.
Each has its own problems - and this isn’t unique to me; reliable tail call detection has long been an issue for
analysis engines. The first method seems sound, however this could produce a lot of false positives for heavily
optimized binaries whose functions aren’t entirely contiguous in a binary. The second method isn’t bad, but it assumes
that all functions are called at least once. It falls apart when a function is only used once and that usage is a
tail call, or worse, it’s used multiple times and all the usages are through tail calls.
Regardless, we’ll use check #2 to catch the low-hanging fruit. Here’s its implementation in code:
|
|
Clearly some more cooking is needed in this department, and that’s exactly
what Vector35 did with BinaryNinja.
Yes, method 2 is used (it won’t catch everything, but it definitely won’t catch the wrong things), as well as “stack
offset analysis”: if the target of a jmp instruction has a stack offset of 0, and the stack offset at the jump site is
also 0, then that counts as a tail call. Why?
A function prologue typically prepares the stack frame
for that function - this reserved space will be used for local variables, saved registers and so on. A function epilogue
‘cleans up’ the stack, deallocating the reserved space and ultimately resetting it to its original state before
execution. So if we see a jmp at a point where the stack offset is 0, and the jump destination also has an offset of
0, then it’s highly likely that the jmp is made from after a function’s epilogue and goes to an address before another
function’s prologue.
During tracing, each instruction is given a stack offset value which represents the depth of the stack before the instruction executes. The snippet below shows how that check looks after analysis.
|
|
Finding this value was a little messy. I maintained a context of registers and their values, and each time a mnemonic
that could likely have an effect on the stack offset (e.g. push, pop, add, sub, or), the register values would
get updated accordingly. Could I have done this better (i.e. SMT solver)? Absolutely. Am I getting paid? Nope.
## Dataflow Analysis
With almost every code rewriting tool I’ve come across, there are some glaring effects on the code produced that easily identifies them.
Perses
Alcatraz

Scatterbrain
Saving flags (and in some cases registers too) before use is required to preserve the original context of the executing
program - only if you’re not aware of what’s in use and what isn’t. The issue? In the context of obfuscation, it
makes analyst’s lives easier. For example, Google relied on locating pushf / popf instructions to locate and
eventually reverse Scatterbrain’s control flow obfuscation.
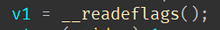
So what can be done? With the information that liveness analysis
provides, we can reduce or completely eliminate the need for pushf, pusha or similar telling mnemonics / behaviours.
I won’t act like an expert in program analysis especially since I was introduced to this technique by someone else. But essentially, one can deduce what variables (in our case, registers / flags) are in use at any point in a program based on whether they are being read from or written to. Example: I read a text file on my computer on day 0, and overwrite it with new content on day 2. That file was not in use for the entirety of day 1. Anyone could have put anything in there that day, and I wouldn’t care since it’d still get overwritten.
That’s the gist of how the analysis would work in our case - walking through our program backwards and tracking the state of registers and flags along the way using the properties of each instruction.
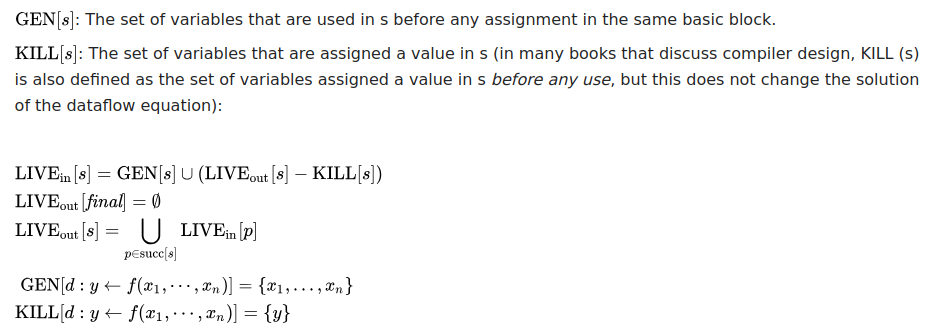
Liveness analysis in terms of dataflow equations (source: Wikipedia)
The implementation is pretty 1:1 with the equations - each basic block maintains GEN and KILL sets (which flags and
registers are read from and written to, respectively), after which the LIVEin and LIVEout sets are generated by
iterating backwards through the function’s exit blocks and their successors using the first 3 equations.
I was referred to the RISC-Y Business project from Secret Club which includes an obfuscator that already implements liveness analysis. After some tweaks for 32-bit compatibility and additional utility APIs, Stitch was now able to provide information on flags and registers that could be used for injecting extra code - no need to save on / restore from the stack anymore.
|
|
Adding more analysis passes is now pretty straightforward. What additional information could be useful to an obfuscator? I’ll leave that as an exercise for the reader.
# Use Stitch
Here’s a very simple program to obfuscate control flow with redundant branches, in less than 50 LOC:
|
|
Stitch is available for public use. There are more examples provided as well as before-and-after images of what this example does to the control flow graph in IDA. It also works with shellcode - although bear in mind that handwritten shellcode may cause you some issues (especially when data is embedded in the code, making it hard to distinguish one from the other).
Although implementations for ELF or Mach-O do not exist at the moment, they should be relatively straightforward to add
thanks to Stitch’s architecture - it just requires implementing the Binary and Section interfaces, after which it
can be immediately used with the existing Code classes (e.g. X86Code).
# Acknowledgements
- Credits to these two for implementation advice and / or just listening to me yap
- Bakki
- Brit
- Secret Club’s RISC-Y Business obfuscator was a good reference for implementing liveness analysis